C# Debugging Doesn’t Work in Cursor!
When I wrote a C# console app in Cursor and pressed the debug button, the following error was displayed.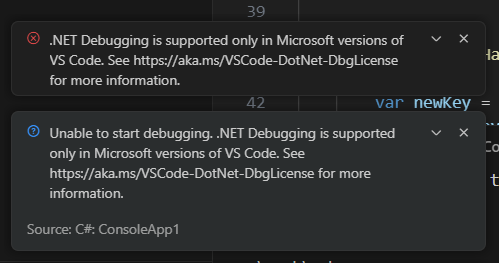
Unable to start debugging. .NET Debugging is supported only in Microsoft versions of VS Code. See https://aka.ms/VSCode-DotNet-DbgLicense for more information.
Apparently, .NET debugging doesn’t work in Cursor…
This article is a record of how I managed to get C# debugging and execution working in Cursor.
Solution
In conclusion, I was able to solve it by referring to the following articles:
- https://guiferreira.me/archive/2025/how-to-debug-dotnet-code-in-cursor-ai/
- https://engincanveske.substack.com/p/debug-your-net-apps-in-cursor-code
However, in my environment, there were many other things I had to tweak to get it to work, so I’ll share what I did as a memorandum.
Prerequisites
It is assumed that you have already installed the necessary extensions for C# execution, for example, by migrating from VSCode.
Also, my execution environment is as follows:
- Windows 11
- Cursor 0.49.x
- PowerShell 7.5.0
1. Install Samsung’s .NET Core Runtime Debugger
It seems that Samsung has open-sourced a .NET Core debugger.
The principle is that by using this, debugging and execution become possible even in Cursor.
For Windows, download the latest netcoredbg-win64.zip from the URL below and extract it to any location.
https://github.com/Samsung/netcoredbg/releases
2. Edit .vscode/launch.json
I configured it as follows:
{
    "version": "0.2.0",
    "configurations": [
        {
            "name": "netcoredbg",
            "type": "coreclr",
            "request": "launch",
            "preLaunchTask": "dotnet: build",
            "program": "${workspaceFolder}\\ConsoleApp1\\bin\\Debug\\net9.0\\ConsoleApp1.dll",
            "args": [],
            "cwd": "${workspaceFolder}",
            "pipeTransport": {
                "pipeCwd": "${workspaceFolder}",
                "pipeProgram": "powershell",
                "pipeArgs": ["-Command"],
                "debuggerPath": "C:\\netcoredbg\\netcoredbg.exe",
                "debuggerArgs": ["--interpreter=vscode"],
                "quoteArgs": true
            },
            "env": {
                "DOTNET_ENVIRONMENT": "Development"
            }
        }
    ]
}
The information varies from site to site, but the above worked for my environment.
Here are some points to note:
- Specify
dotnet: buildforpreLaunchTaskinstead ofbuild- There is no need to create .vscode/tasks.json
- For
program, specify the .dll file of the application you want to run- Usually, it should be in the format
ApplicationName.dll
- Usually, it should be in the format
- For
pipeTransport.debuggerPath, specify the file path to netcoredbg.exe downloaded in step 1- .exe can be omitted
3. Execute
Select netcoredbg from Run and Debug in the left menu and execute it.
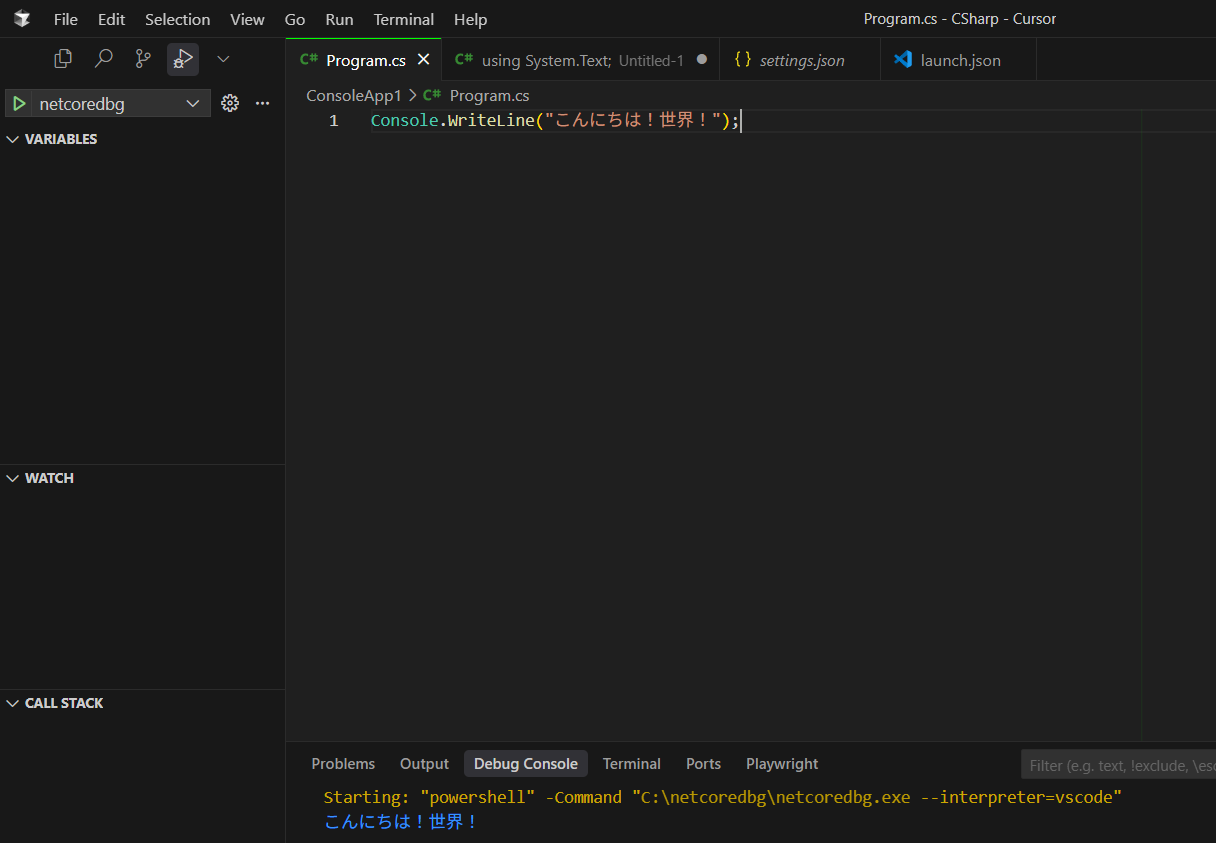
It worked successfully!
Summary
By installing Samsung’s debugger, you can debug C# even in Cursor.
C# is a language that can be used in various frameworks, including web development, game development, Windows applications, and mobile apps.
Being able to run C# in Cursor allows you to develop and debug C# while utilizing AI assistance, greatly expanding your development possibilities.
Ideally, Microsoft would enable C# debugging in Cursor, but for now, this method is a good way to bypass the restriction.